Monday 29 June 2015

Web mapping with ESRI Cloud (AGOL)

GIS Analysts, who wish to try their hands on Web Mapping, yet have no programming knowledge or skill!!!! ESRI's cloud could be your best training ground. What i love about ArcGis Online is that it's simple, elegent and yet highly scalable and complex.  First, let me take you through the what you can leverage of this product:

Free access for limited content:

1. ArcMap map services need not take the tough route of being prepared as Service Definition Files , to be published on Web. All that is required, to publish limited content, is an Global ESRI Account and spatial Datasets (Either CSV or Zipped Shapefiles).
2. Configurable Pop-up's, symbology and  to some extent Legend.
3. Standard Templates, that help users with no HTML or CSS knowledge to pick and choose from the standard interfaces. These Templates are dynamic and are so filled with interactive controls , that it let's your users analyze for information, pattern and trends.
4. Responsive WebApplications of the map templates that can be shared over mail or embedded into your url.

Organizational Account:

Why invest in an expensive ESRI ArcServer when most of it's capabilities can be leveraged through ArcGis Online? Well ya,..... At an enterprise level ArcServer may be the best choice. But for Small to medium workgroups, who intent to publish  only map tiles and Feature services,  AGOL may be the best Choice. The organization has an option to publish maps on Web, Mobile and  Tabs. Geo processing controls are achieved through ESRI API for JavaScript and Like ArcServer, Veiwers of Flex and Silverlight can be used as well. An organizational Account is also powered with Analytics. 

How to get started with your ESRI AGOL Free Mapping:

1.  Log on to http://www.arcgis.com/home/ . Create a Global Account for yourself.

2.  Hover to "MAP" on Header section (Top section) on the Homepage.

3.  You should now see a base map layer, where you can  "Add Layer" to create overlays. Now, you have two choices. Either to use ESRI layers as map overlay and prepare you webmaps or to choose  your own map layer generated from ArcMap. A custom map service, should ideally be a "csv" format dataset with an spatial context or an zipped shapefile to upto 1000 attributes.

4. Once you are "Done adding Layers", "Save" the map and click on the "Share" icon, to access the ESRI WebMapping templates. Based on the context of you web map, ESRI has provided templates that you can choose from. 

5. Test the interface of your map, it's text and legend elements, both on Desktop web and Mobile. Play around with positioning, colors and text. Once you're all done, your first (Basic) web map is all set to be shared.

The first time, i tried my hands on capabilities of AGOL, i dd not know the creation of web maps can be made possible, relatively this simple. Though, the free mapping option of AGOL, provides limited access to create basic Spatial web services, it surely does open the users into the realm of web mapping. Try your hands on, as much as you can with AGOL!!! This is your sandbox to get a feel of what it takes of Mapping Interfaces and a platform that will gear you up into the real programming world of web mapping.,... I intent to keep the blog updated on the developer training of mapping web services. 
Until, then:

Happy Mapping :-)


ArcMap Geo-Coding

Aim:
 To Geo-code the address of Schools.

Procedure:

Step 1: Map Input
Address of Schools in Excel or Stand-alone Table Format (With Road Name, City, State), Reference Data (Census Data or OSM data for Non- US, possibility).

Step 2: Map Processing
1.       Enable the Geo-coding Extension with ArcGis
2.       Build an Address Locator using “Create Address Locator” Tool of Geocoding toolbox or by right-clicking on your geo-database (Feature Dataset).
3.       On the Address Locator Style Specify “Single Field” (This is mostly for Non-US, where the Address sequence does not follow a nationally uniform sequence. For US it is best to use “Dual Ranges”)
4.       Add on the Reference Data as the OSM Data set and set the Filed Map with appropriate Field Name and Alias Name. Make sure to set the primary key field to Street Name or House Number, through which the address matching will be processed.
5.       Now, to initiate Geo-coding of School Address Table, Click on the Geo-code address icon of the extension tool bar. Specify the attribute field name, which will link with the address locator’s primary key field.  One may also specify, Geo-coding Options of Spelling Sensitivity, Minimum Candidate Score,….
6.       Run Geocoding.  The results page with Matched/Unmatched and Tied Records.

Step 3: Map Display
7.        Generate Map Outputs of Geo-coding result, Matched Results (Select by attributes of Table and Export as shapefile) and Screen shot of results page.


Network Analyst: Closest Facility (with Barriers)

Aim:
 To create a Closest Facility Map with Road Blocks through the use of Network Analyst toolset

Procedure:

Step 1: Map Input
A Base map or toposheet on which Roads and Facilities Point features are digitized and exported as shapefiles. Also, identify, polygon barriers (Like construction locations where Roads are blocked)

Step 2: Map Processing
·         Geo-reference the base map with known location coordinates.
·         Import the digitized Line and Point shapefiles into the target Geo-database.
·         All Line entities of road feature class, needs to be split into right-angles at junctions. Hence use the Planarize line tool from Topology tool options under Editing mode.
·         In ArcCatalog, create a Network Dataset and add Road features.
·         Enable the Network Analyst option in Extension and choose the Closest Facility analysis.
·         In this section, identify and locate Polygon Barriers. This can be any Road Blocks along the route of the road feature class.
·         For Closest Facility analysis, the location of Facilities point and Incident Points are mandatory. One may choose to identify these Facility and Incident Locations manually or load point location shape file(s) created from the base map.
·         On properties of closest facility, set the Impedance to Break Values of Length in Meters.
·         Solve for Closest Facility. The Closest Facility Route Map (In custom Break Values) will be generated for Facilities Point Location.

Step 3: Map Display
 The final Output map can be displayed with Map Elements and grid properties of Layout.

Conclusion:

A Closest Facility route Map, with routes without road bloacks is generated through the use of Network Analyst extension of ArcMap.

Network Analyst: Closest Facility

Aim:
 To create a Closest Facility Map through the use of Network Analyst toolset

Procedure:

Step 1: Map Input
A Base map or toposheet on which Roads and Facilities Point features are digitized and exported as shapefiles.

Step 2: Map Processing
·         Geo-reference the base map with known location coordinates.
·         Import the digitized Line and Point shapefiles into the target Geo-database.
·         All Line entities of road feature class, needs to be split into right-angles at junctions. Hence use the Planarize line tool from Topology tool options under Editing mode.
·         In ArcCatalog, create a Network Dataset and add Road features.
·         Enable the Network Analyst option in Extension and choose the Closest Facility analysis.
·         For Closest Facility analysis, the location of Facilities point and Incident Points are mandatory. One may choose to identify these Facility and Incident Locations manually or load point location shape file(s) created from the base map.
·         On properties of closest facility, set the Impedance to Break Values of Length in Meters.
·         Solve for Closest Facility. The  Closest Facility Route Map (In custom Break Values) will be generated for Facilities Point Location.

Step 3: Map Display
 The final Output map can be displayed with Map Elements and grid properties of Layout.

Conclusion:

A Closest Facility route Map through the use of Network Analyst toolset is created.

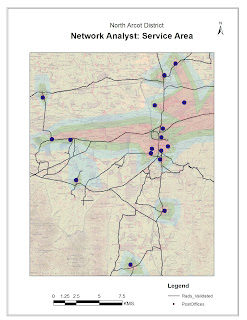
Network Analyst: Service Area

Aim:
 To create a Service Map through the use of Network Analyst toolset

Procedure:

Step 1: Map Input
A Base map or toposheet on which Roads and Facilities Point features are digitized and exported as shapefiles.

Step 2: Map Processing
·         Geo-reference the base map with known location coordinates.
·         Import the digitized Line and Point shapefiles into the target Geo-database.
·         All Line entities of road feature class, needs to be split into right-angles at junctions. Hence use the Planarize line tool from Topology tool options under Editing mode.
·         In ArcCatalog, create a Network Dataset and add Road features.
·         Enable the Network Analyst option in Extension and choose the Service Area analysis.
·         For Service Area analysis, the location of Facilities point is mandatory. One may choose to identify these Facility Locations manually or load point location shape file created from the base map.
·         On properties of Service Area, Set the Impedance to Break Values of Length in Meters.
·         Solve for Service Area. The Service Area (In custom Break Values) will be generated for Facilities Point Location.

Step 3: Map Display
 The final Output map can be displayed with Map Elements and grid properties of Layout.

Conclusion:
A Service Area Map through the use of Network Analyst toolset is created.

Network Analyst: New Route

Aim:
 To create a New Route Map through the use of Network Analyst toolset

Procedure:

Step 1: Map Input
A Base map or toposheet on which Roads and Facilities Point features are digitized and exported as shapefiles.

Step 2: Map Processing
·         Geo-reference the  base map with known location coordinates.
·         Import the digitized Line and Point shapefiles into the target Geo-database.
·         All Line entities of road feature class, needs to be split into right-angles at junctions. Hence use the Planarize line tool from Topology tool options under Editing mode.
·         In ArcCatalog, create a Network Dataset and add Road features.
·         Enable the Network Analyst option in Extension and choose the New Route analysis.
·         For New Route analysis, the location of Stops point is mandatory. One  may choose to identify these Stop  Locations manually or load point shape file created from the base map.
·         Solve for New Route. The shortest route between the facilities point with be generated.

          
Step 3: Map Display
 The final Output map can be displayed with Map Elements and grid properties of Layout.

Conclusion:

A New Route Map through the use of Network Analyst toolset is created.

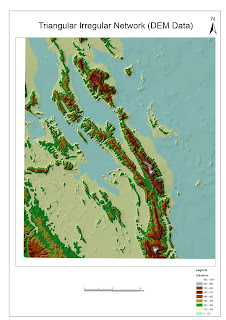
TIN (through DEM Data)

Aim:
 To create a TIN Map  using DEM data sourced from public domain.

Procedure:

Step 1: Map Input
A Digital Elevation Data from USGS.GOV website. For this session SRTM data was chosen
The boundary shapefile of the location

Step 2: Map Processing
·         Confine the extent of the SRTM DEM Data to that of the location boundary, using Data Management -> Raster Processing -> Clip (Tool).
·         Create elevation Contours of the SRTM DEM data using Contour (Spatial Analyst) tool.
·         Create TIN (Spatial Analyst) from the Contour Map created in the previous step.

Step 3: Map Display
 The final Output map can be displayed with Map Elements and grid properties of Layout. For smoothing, remove Hard Edges from symbology of map layer.

 Conclusion:

A Triangular Irregular Network Map from DEM Data is created on ArcMap.

ArcMap: Model Builder

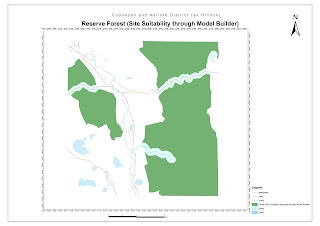
Aim:  To build site suitability for Forest Reserve Area through the use of Model Builder

Procedure:

Step 1: Map Input
The point (settlements), line (Roads and Rivers) and Area (Forest) digitized maps of the toposheet of Cuddapah and Nellore districts.

Step 2: Map Processing
·          Create a New model and new toolbox. .
·         Drag drop the target inputs (Selected Shapefiles) into the new model
·         Drag and drop the custom geo-processing tools (from ArcMap toolbox) so to create a desired output. For this session a buffer tool with custom buffer area values were given.
Lake: 700 Meters
River: 600 Meters
Road: 450 Meters
Settlement:  500 Meters
·         If further manipulation of the resulting output is desired, drag and drop more geo-processing tools (from ArcMap toolbox) and shapefile layers.  For this session the resultant buffer layers was erased from parent Forest layer.  
·         Validate and Run the final Model

Step 3: Map Display
 The final Output map can be displayed with Map Elements and grid properties of Layout

 Conclusion:
A Site Suitability Map of ideal Forest Reserve Area is analyzed trough Model Builder and displayed using ArcMap Layout properties.

Triangular irregular Network (TIN)

Aim:
To digitize contour points and extrapolate a Triangular irregular network map from them.  Visualization trough Arcscene  is also to be performed.
Procedure:
Step 1: Map Input
Create points of contour elevation and save them in the respective shapefile.  The contour elevation is computed from a known elevation value specified in the basemap or topographic sheet. 
Step 2: Map Processing
·         Use “Create TIN” tool to generate a TIN map from the contour point shapefile.
·         Use ArcScene, Software, to input the TIN map create through ArcMap.
·         In Z-values are not present, exaggerate vertical height through scene properties options available on scene layers of toolbar.
·         Use Animation, video options to view 3D mapping of the TIN Map layer.

Step 3: Map Display
Export Map to 2D from ArcScene and Export map to Jpeg format. 
Conclusion:

A TIN map from contour map points is generated in ArcMap and visualized in 3D format through ArcScene.

Spatial/Demographic Analysis: Bar Diagram

Aim:
To create perform demographic analysis on Census 2011 data through ArcGis symbology tools and spatial join methods and represent the output as Bar Chart symbol.
Procedure:
Step 1: Map Input
Census Data: Census or demographic data on which analysis will be performed.  For this session, The Census data of Tamilnadu for the year 2011 was taken.
Location feature: Shapefile of the location feature. For this session, shapefile of Tamilnadu, India was processed.
Step 2: Map Processing
·         Perform a spatial join through a primary key id (Common ID) between the location shapefile and census dataset.  If the common ID is not present between data, create a FieldID and link the names of sub-features and districts of location and datasets, respectively. 
·         Select an attribute, and calculate a preferred deduced value using field calculation. For this session Female illiteracy and Male illiterate population was taken.
·         Using “Pie” under charts of symbology, display the female illiteracy and male illiteracy percentage calculated. The number of classes, for display is scientifically computed as K = 3.3 Log N, where K is the number of classes and N is the total number of attributes in the location data set.  
·         Method of classification can differ from the quality of data type. For this session, Natural Breaks (Jenks) was considered.
·         Click “Ok” to generate the map output
Step 3: Map Display
Create Custom Map Layout with the necessary map elements and Export map to Jpeg format. 
Conclusion:

Demographic data is analyzed for female illiteracy Vs Male Illiteracy rates and displayed using Bar Chart in ArcGis 10.1.

Spatial/Demographic Analysis: Pie Diagram

Aim:
To create perform demographic analysis on Census 2011 data through ArcGis symbology tools and spatial join methods and represent the output as Pie Chart symbol.
Procedure:
Step 1: Map Input
Census Data: Census or demographic data on which analysis will be performed.  For this session, The Census data of Tamilnadu for the year 2011 was taken.
Location feature: Shapefile of the location feature. For this session, shapefile of Tamilnadu, India was processed.
Step 2: Map Processing
·         Perform a spatial join through a primary key id (Common ID) between the location shapefile and census dataset.  If the common ID is not present between data, create a FieldID and link the names of sub-features and districts of location and datasets, respectively. 
·         Select an attribute, and calculate a preferred deduced value using field calculation. For this session Female illiteracy and Male illiterate population was taken.
·         Using “Pie” under charts of symbology, display the female illiteracy and male illiteracy percentage calculated. The number of classes, for display is scientifically computed as K = 3.3 Log N, where K is the number of classes and N is the total number of attributes in the location data set.  
·         Method of classification can differ from the quality of data type. For this session, Natural Breaks (Jenks) was considered.
·         Click “Ok” to generate the map output
Step 3: Map Display
Create Custom Map Layout with the necessary map elements and Export map to Jpeg format. 
Conclusion:

Demographic data is analyzed for female illiteracy Vs Male Illiteracy rates and displayed using Pie Chart in ArcGis 10.1.

Spatial/Demographic Analysis: Graduated Symbol

Aim:
To create perform demographic analysis on Census 2011 data through ArcGis symbology tools and spatial join methods and represent the output as Graduated symbol.
Procedure:
Step 1: Map Input
Census Data: Census or demographic data on which analysis will be performed.  For this session, The Census data of Tamilnadu for the year 2011 was taken.
Location feature: Shapefile of the location feature. For this session, shapefile of Tamilnadu, India was processed.
Step 2: Map Processing
·         Perform a spatial join through a primary key id (Common ID) between the location shapefile and census dataset.  If the common ID is not present between data, create a FieldID and link the names of sub-features and districts of location and datasets, respectively. 
·         Select an attribute, and calculate a preferred deduced value using field calculation. For this session Female illiteracy as a percentage Total illiterate population was taken.
·         Using “Graduated symbol” under quantities of symbology, display the female illiteracy percentage calculated. The number of classes, for display is scientifically computed as K = 3.3 Log N, where K is the number of classes and N is the total number of attributes in the location data set.  
·         Method of classification can differ from the quality of data type. For this session, Natural Breaks (Jenks) was considered.
·         Click “Ok” to generate the map output
Step 3: Map Display
Create Custom Map Layout with the necessary map elements and Export map to Jpeg format. 
Conclusion:

Demographic data is analyzed for female illiteracy rates and displayed using graduated symbols in ArcGis 10.1.