Aim:
To create perform demographic analysis on Census 2011 data
through ArcGis symbology tools and spatial join methods.
Procedure:
Step 1: Map Input
Census Data: Census or demographic data on which analysis
will be performed. For this session, The
Census data of Tamilnadu for the year 2011 was taken.
Location feature: Shapefile of the location feature. For
this session, shapefile of Tamilnadu, India was processed.
Step 2: Map
Processing
- · Perform a spatial join through a primary key id (Common ID) between the location shapefile and census dataset. If the common ID is not present between data, create a FieldID and link the names of sub-features and districts of location and datasets, respectively.
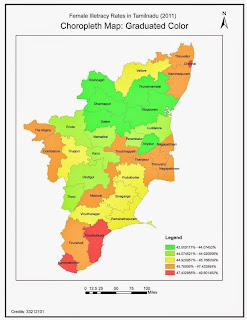
- · Select an attribute, and calculate a preferred deduced value using field calculation. For this session Female illiteracy as a percentage Total illiterate population was taken.
- · Using “Graduated Color” under quantities of symbology, display the female illiteracy percentage calculated. The number of classes, for display is scientifically computed as K = 3.3 Log N, where K is the number of classes and N is the total number of attributes in the location data set.
- · Method of classification can differ from the quality of data type. For this session, Natural Breaks (Jenks) was considered.
- · Click “Ok” to generate the map output

Step 3: Map Display
Create Custom Map Layout with the necessary map elements and
Export map to Jpeg format.
Conclusion:
Demographic data is analyzed for female illiteracy rates and
displayed using graduated colors in ArcGis 10.1.
No comments:
Post a Comment