Thursday, 19 February 2015

Arcgis10.1: Digitization of Spatial Entities

Aim:
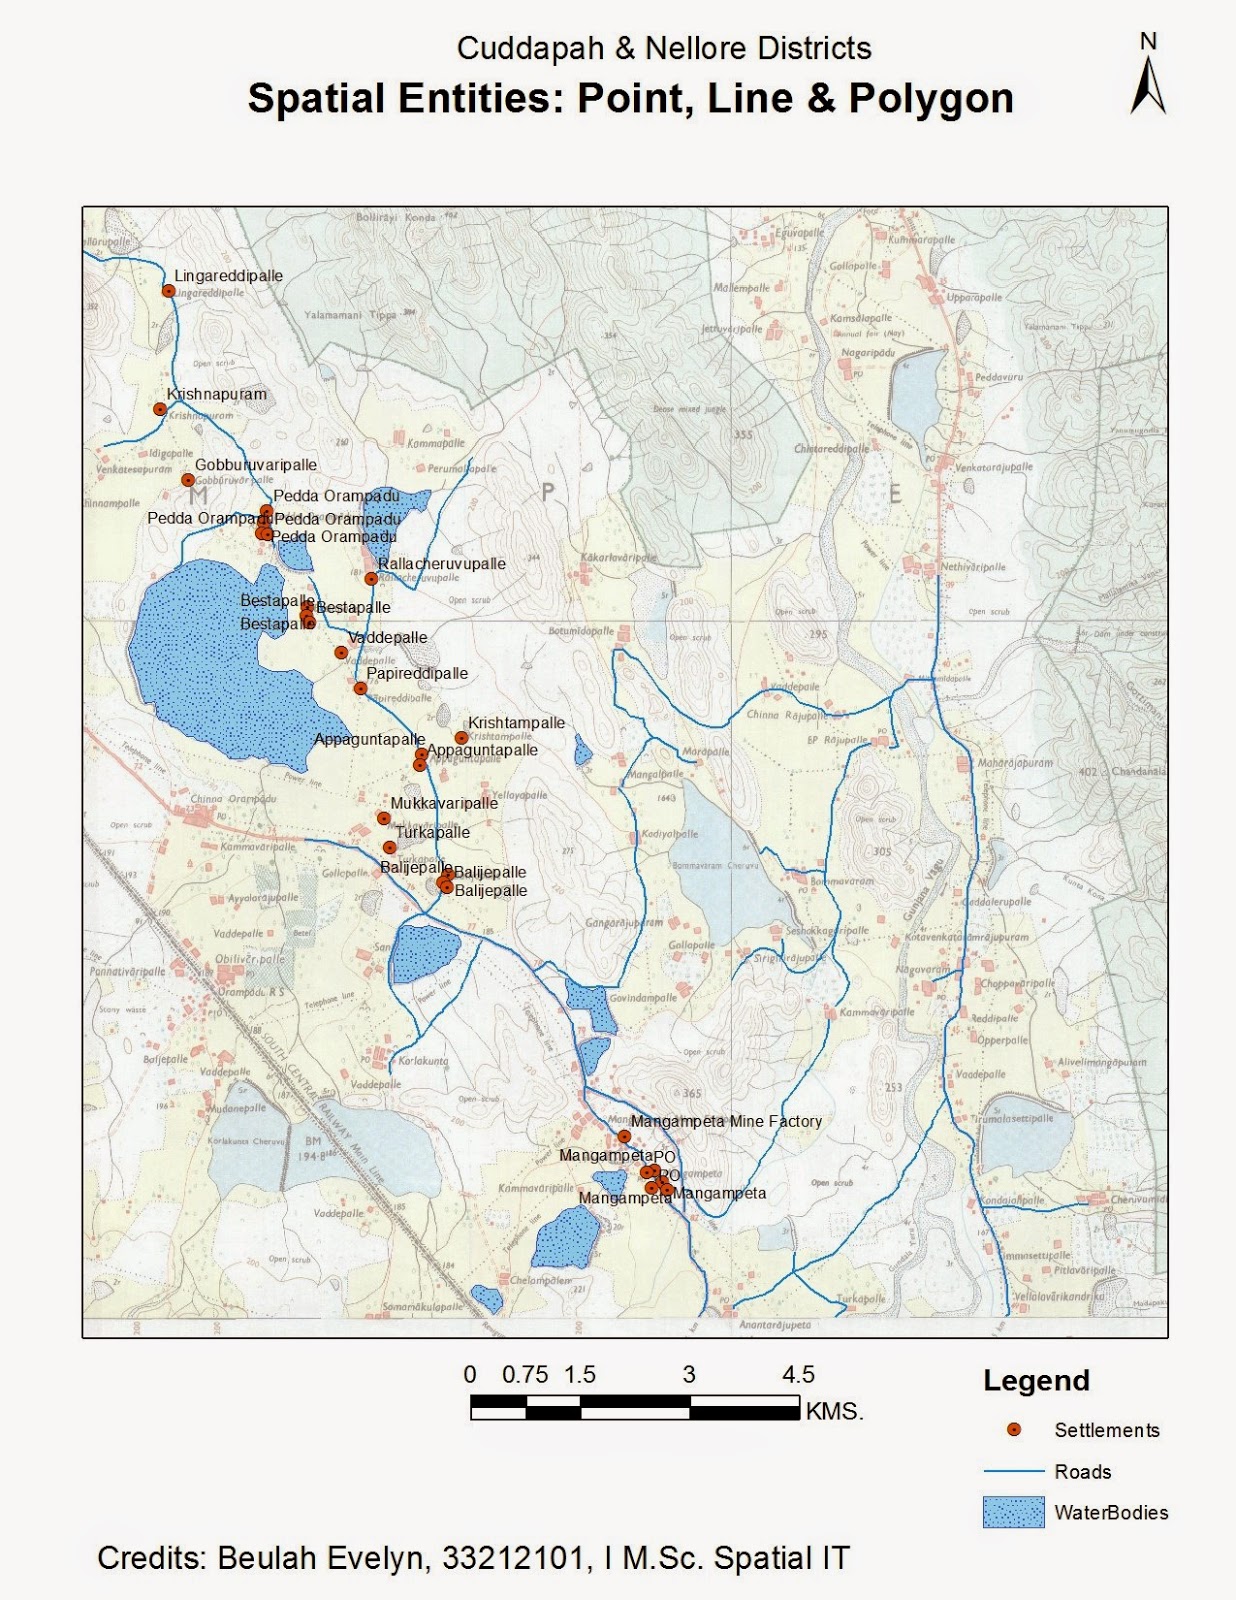
To create Point, Line and Polygon entity features for the given topographic sheet, using ArcGis Editing tools

Procedure:

Step 1: Map Input
Identify the Point, Line and Polygon Entities and the location datasets. For this session, Cities were located for Point, Rivers were located for rivers and Perennial water bodies were located as polygon  entities on the given topographic sheet. 


Step 2: Map Processing
·         Create a New polygon Shapefile in ArcCatalog (target Folder) and Add Field for ‘Name” in the Attribute Table of polygon Shapefile layer.
·         Start “Editor” and symbolize the line entities using “Create Features” Point, Line and polygon Construction tools.
·         Save and Stop “Editor”
·         Label the Point, Line and Polygon  entities with the “Name” of the Cities, Rivers and water bodies. In this case, Names were not accurately identified; hence Dam Capacity was selected for labeling.
·         Layout map with elements of Title, Sub-Title, Scale, Arrow,  Legend and credits

Step 3: Map Display
Export map to Jpeg format

Conclusion:

The Spatial entity features for the given topographic sheet are processed and displayed using ArcGis.

Arcgis10.1: Digitization of Polygon Entities

Aim:
To create Polygon entity features for the given topographic sheet, using ArcGis Editing tools.

Procedure:

Step 1: Map Input
Identify the Polygon Entities and the location datasets. For this sess
ion, Perennial water bodies were located as polygon  entities on the given topographic sheet.

Step 2: Map Processing
·         Create a New polygon Shapefile in ArcCatalog (target Folder) and Add Field for ‘Name” in the Attribute Table of polygon Shapefile layer.
·         Start “Editor” and symbolize the line entities using “Create Features” polygon Construction tools.
·         Save and Stop “Editor”
·         Label the Polygon entities with the “Name” of the water bodies. In this case, Names were not accurately identified; hence Dam Capacity was selected for labeling.
·         Layout map with elements of Title, Sub-Title, Scale, Arrow,  Legend and credits

Step 3: Map Display
Export map to Jpeg format

Conclusion:

The Polygon entity features for the given topographic sheet are processed and displayed using ArcGis.

Arcgis10.1: Digitization of Line Entities

Aim:
To create line entity features for the given topographic sheet, using ArcGis Editing tools

Procedure:

Step 1: Map Input
Identify the line  Entities and the location datasets. For this session, Road Network were located as line entities on the given topographic sheet

Step 2: Map Processing
·         Create a New polyline Shapefile in ArcCatalog (target Folder) and Add Field for ‘Name” in the Attribute Table of line Shapefile layer.
·         Start “Editor” and symbolize the line entities using “Create Features” line Construction tools.
·         Save and Stop “Editor”
·         Label the line entities with the “Name” of the Roads. In this case, Names were not identified, hence ignored.

·         Layout map with elements of Title, Sub-Title, Scale, Arrow,  Legend and credits

Step 3: Map Display
Export map to Jpeg format

Conclusion:

The line entity features for the given topographic sheet are processed and displayed using ArcGis.

Arcgis10.1: Digitization of Point Entities


Aim:
To create point entity features for the given topographic sheet, using ArcGis Editing tools.

Procedure:

Step 1: Map Input
Identify the Point Entities and the location datasets. For this session, Settlements were located as point entities on the given topographic sheet

Step 2: Map Processing
·         Create a New Point Shapefile in ArcCatalog (target Folder) and Add Field for ‘Name” in the Attribute Table of Point Shapefile layer.
·         Start “Editor” and Symbolize the point entities using “Create Features” Point Construction tools.
·         Save and Stop “Editor”
·         Label the points entities with the “Name” of Settlements
·         Layout map with elements of Title, Sub-Title, Scale, Arrow,  Legend and credits

Step 3: Map Display
Export map to Jpeg format
Conclusion:

The point entity features for the given topographic sheet are processed and displayed using ArcGis.

Arcgis10.1: Geo-Referencing


Aim:
To geo-reference the given topographic sheet. (Please read post on Concept of geo-reference prior to this session.) 

Procedure:

Step 1: Map Input
Identify the known co-ordinate location for the topographic sheets. In this session, the four corner Co-ordinates were identities.  Compute the Decimal Degrees for these known coordinates.

Step 2: Map Processing
·         Geo-reference using the “Geo-referencing” toolbar
·         Update the Computed decimal degrees in the respective coordinate points
·         Check for RMS error (Should be ideally zero or less than One)
·         Rectify Image and save a copy for the local drive
·         Layout map with elements of Title, Sub-Title, Scale, Arrow,  Legend and credits

Step 3: Map Display                        
Export map to Jpeg format

Conclusion:
The given topographic sheet in Geo-referenced using ArcGis. 

Arcview3.2a: Choropleth Map

Aim:
To create a Choropleth Map for the chosen attributes.

Procedure:

Step 1: Map Input
Identify the attribute component for the location dataset. For this session, Population Density, was chosen for the country of United States.

Step 2: Map Processing
·         “Add Field” to the Table, and use “Field Calculator” to Compute Population Density. Population density is given as Population per Sq Area.
·         Symbolize the attribute using “Graduated Color” options in Properties of the data set.
·         Manipulate the datasets for the desired “Class Intervals” and “color Scheme”
·         Layout map with elements of Title, Sub-Title, Scale, Arrow,  Legend and credits

Step 3: Map Display
Export map to Jpeg format

Conclusion:

Choropleth Map using for the chosen attributes was processed and displayed using ArcView 3.2a.

Arcview3.2a: Choro-chromatic Map


Aim:
To create a Density map for the chosen attributes.

Procedure:

Step 1: Map Input
Identify the attribute component for the location dataset. For this session, Total Population,  was chosen for the country of United States.

Step 2: Map Processing
·         Symbolize the attribute using “Graduated Symbol” options in Properties of the data set.
·         Manipulate the datasets for the desired “Symbol Properties” and “color Scheme”
·         Layout map with elements of Title, Sub-Title, Scale, Arrow,  Legend and credits
Step 3: Map Display
Export map to Jpeg format

Conclusion:

Density Map using unique symbol for the chosen attributes was processed and displayed using ArcView 3.2a.