Thursday, 19 February 2015

Arcgis10.1: Digitization of Spatial Entities

Aim:
To create Point, Line and Polygon entity features for the given topographic sheet, using ArcGis Editing tools

Procedure:

Step 1: Map Input
Identify the Point, Line and Polygon Entities and the location datasets. For this session, Cities were located for Point, Rivers were located for rivers and Perennial water bodies were located as polygon  entities on the given topographic sheet. 


Step 2: Map Processing
·         Create a New polygon Shapefile in ArcCatalog (target Folder) and Add Field for ‘Name” in the Attribute Table of polygon Shapefile layer.
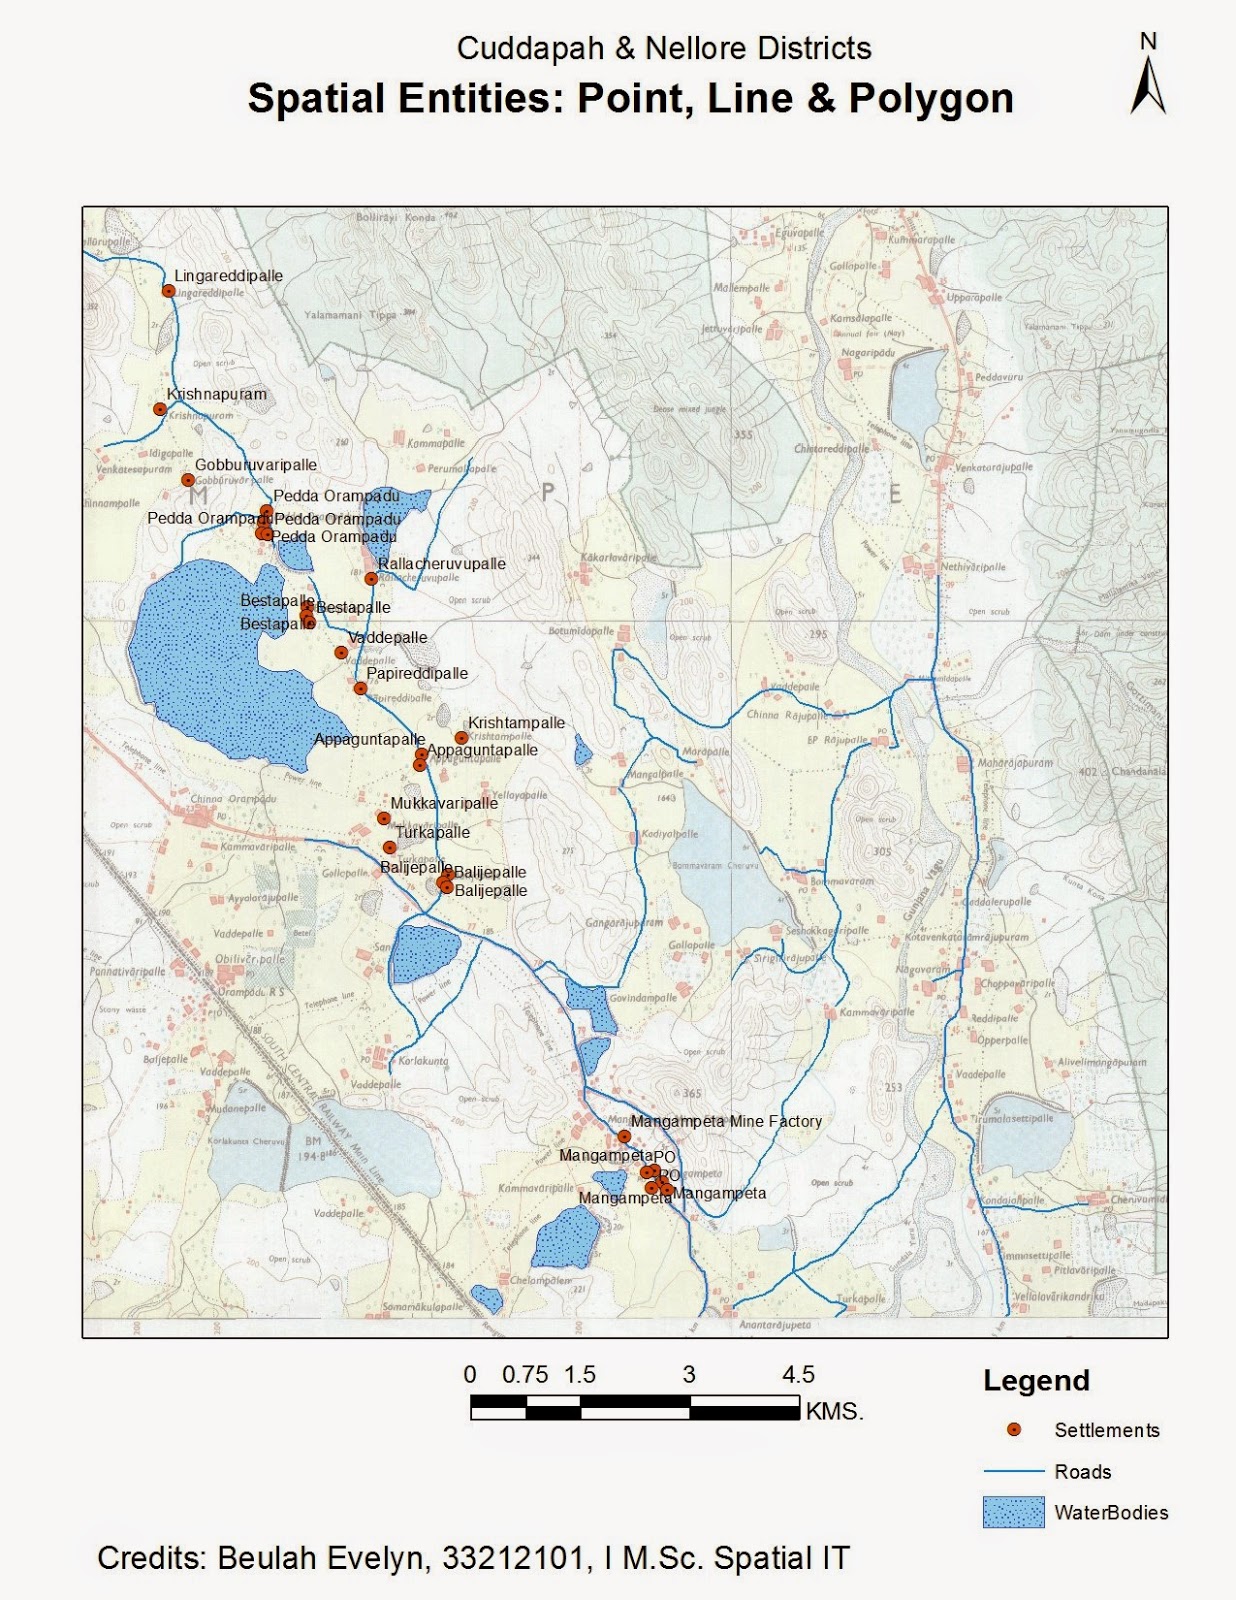
·         Start “Editor” and symbolize the line entities using “Create Features” Point, Line and polygon Construction tools.
·         Save and Stop “Editor”
·         Label the Point, Line and Polygon  entities with the “Name” of the Cities, Rivers and water bodies. In this case, Names were not accurately identified; hence Dam Capacity was selected for labeling.
·         Layout map with elements of Title, Sub-Title, Scale, Arrow,  Legend and credits

Step 3: Map Display
Export map to Jpeg format

Conclusion:

The Spatial entity features for the given topographic sheet are processed and displayed using ArcGis.

Arcgis10.1: Digitization of Polygon Entities

Aim:
To create Polygon entity features for the given topographic sheet, using ArcGis Editing tools.

Procedure:

Step 1: Map Input
Identify the Polygon Entities and the location datasets. For this sess
ion, Perennial water bodies were located as polygon  entities on the given topographic sheet.

Step 2: Map Processing
·         Create a New polygon Shapefile in ArcCatalog (target Folder) and Add Field for ‘Name” in the Attribute Table of polygon Shapefile layer.
·         Start “Editor” and symbolize the line entities using “Create Features” polygon Construction tools.
·         Save and Stop “Editor”
·         Label the Polygon entities with the “Name” of the water bodies. In this case, Names were not accurately identified; hence Dam Capacity was selected for labeling.
·         Layout map with elements of Title, Sub-Title, Scale, Arrow,  Legend and credits

Step 3: Map Display
Export map to Jpeg format

Conclusion:

The Polygon entity features for the given topographic sheet are processed and displayed using ArcGis.

Arcgis10.1: Digitization of Line Entities

Aim:
To create line entity features for the given topographic sheet, using ArcGis Editing tools

Procedure:

Step 1: Map Input
Identify the line  Entities and the location datasets. For this session, Road Network were located as line entities on the given topographic sheet

Step 2: Map Processing
·         Create a New polyline Shapefile in ArcCatalog (target Folder) and Add Field for ‘Name” in the Attribute Table of line Shapefile layer.
·         Start “Editor” and symbolize the line entities using “Create Features” line Construction tools.
·         Save and Stop “Editor”
·         Label the line entities with the “Name” of the Roads. In this case, Names were not identified, hence ignored.

·         Layout map with elements of Title, Sub-Title, Scale, Arrow,  Legend and credits

Step 3: Map Display
Export map to Jpeg format

Conclusion:

The line entity features for the given topographic sheet are processed and displayed using ArcGis.

Arcgis10.1: Digitization of Point Entities


Aim:
To create point entity features for the given topographic sheet, using ArcGis Editing tools.

Procedure:

Step 1: Map Input
Identify the Point Entities and the location datasets. For this session, Settlements were located as point entities on the given topographic sheet

Step 2: Map Processing
·         Create a New Point Shapefile in ArcCatalog (target Folder) and Add Field for ‘Name” in the Attribute Table of Point Shapefile layer.
·         Start “Editor” and Symbolize the point entities using “Create Features” Point Construction tools.
·         Save and Stop “Editor”
·         Label the points entities with the “Name” of Settlements
·         Layout map with elements of Title, Sub-Title, Scale, Arrow,  Legend and credits

Step 3: Map Display
Export map to Jpeg format
Conclusion:

The point entity features for the given topographic sheet are processed and displayed using ArcGis.

Arcgis10.1: Geo-Referencing


Aim:
To geo-reference the given topographic sheet. (Please read post on Concept of geo-reference prior to this session.) 

Procedure:

Step 1: Map Input
Identify the known co-ordinate location for the topographic sheets. In this session, the four corner Co-ordinates were identities.  Compute the Decimal Degrees for these known coordinates.

Step 2: Map Processing
·         Geo-reference using the “Geo-referencing” toolbar
·         Update the Computed decimal degrees in the respective coordinate points
·         Check for RMS error (Should be ideally zero or less than One)
·         Rectify Image and save a copy for the local drive
·         Layout map with elements of Title, Sub-Title, Scale, Arrow,  Legend and credits

Step 3: Map Display                        
Export map to Jpeg format

Conclusion:
The given topographic sheet in Geo-referenced using ArcGis. 

Arcview3.2a: Choropleth Map

Aim:
To create a Choropleth Map for the chosen attributes.

Procedure:

Step 1: Map Input
Identify the attribute component for the location dataset. For this session, Population Density, was chosen for the country of United States.

Step 2: Map Processing
·         “Add Field” to the Table, and use “Field Calculator” to Compute Population Density. Population density is given as Population per Sq Area.
·         Symbolize the attribute using “Graduated Color” options in Properties of the data set.
·         Manipulate the datasets for the desired “Class Intervals” and “color Scheme”
·         Layout map with elements of Title, Sub-Title, Scale, Arrow,  Legend and credits

Step 3: Map Display
Export map to Jpeg format

Conclusion:

Choropleth Map using for the chosen attributes was processed and displayed using ArcView 3.2a.

Arcview3.2a: Choro-chromatic Map


Aim:
To create a Density map for the chosen attributes.

Procedure:

Step 1: Map Input
Identify the attribute component for the location dataset. For this session, Total Population,  was chosen for the country of United States.

Step 2: Map Processing
·         Symbolize the attribute using “Graduated Symbol” options in Properties of the data set.
·         Manipulate the datasets for the desired “Symbol Properties” and “color Scheme”
·         Layout map with elements of Title, Sub-Title, Scale, Arrow,  Legend and credits
Step 3: Map Display
Export map to Jpeg format

Conclusion:

Density Map using unique symbol for the chosen attributes was processed and displayed using ArcView 3.2a.

Arcview3.2a: Distribution Map

Aim:
To create a Distribution Map using Dot Density method for the chosen attributes.

Procedure:

Step 1: Map Input
Identify the attribute component for the location dataset. For this session, Total Population, was chosen for the country of United States.
Step 2: Map Processing
·         Symbolize the attribute using “DOT” options in Properties of the data set.
·         Manipulate the datasets for the desired “Density Value”, “Dot Size” and “color Scheme”
·         Layout map with elements of Title, Sub-Title, Scale, Arrow,  Legend and credits

Step 3: Map Display
Export map to Jpeg format


Conclusion:

Distribution Map using Dot Density method with the chosen attributes was processed and displayed using ArcView 3.2a.

Wednesday, 18 February 2015

Arcview3.2a: Located Pie Chart

Aim:
To create a located Pie Chart using the chosen attributes.

Procedure:

Step 1: Map Input
Identify the attribute component for the location dataset. For this session, White Population as a component of Total Population was chosen for the country of United States.

Step 2: Map Processing
·         Symbolize the attribute using “Pie” options in Properties of the data set.
·         Manipulate the datasets for the desired “ “color Scheme”
·         Layout map with elements of Title, Sub-Title, Scale, Arrow,  Legend and credits

Step 3: Map Display
Export map to Jpeg format

Conclusion:

Located Pie Chart with the chosen attributes was Processed and displayed using ArcView 3.2a.

Arcview3.2a: Located Bar Diagram

Aim:
To create a located Bar Diagram using the chosen attributes.

Procedure:

Step 1: Map Input
Identify the attribute component for the location dataset. For this session, White Population as a component of Total Population was chosen for the country of United States.

Step 2: Map Processing
·         Symbolize the attribute using “Graduated Colors” options in Properties of the data set.
·         Manipulate the datasets for the desired “Class Intervals” and “color Scheme”
·         Layout map with elements of Title, Sub-Title, Scale, Arrow,  Legend and credits

Step 3: Map Display
Export map to Jpeg format

Conclusion:

Located Bar Diagram with the chosen attributes was processed and displayed using ArcView 3.2a.

ArcView3.2a: Spatial Entity

Aim:
To create all entity features for the chosen location

Procedure:

Step 1: Map Input
Identify the Point, Line and polygon Entities and the location datasets. For this session, Capital Cities, Rivers and Lakes were located as respective  entities for Provinces of the country of Canada .

Step 2: Map Processing
·         Symbolize the point, Line and Polygon entities of each layer,  using “Symbol Selector”
·         Label the name of Point Entities with the “Name” of City. (For visually pleasing map the labeling is restricted only to Point Entities for this exercise).
·         Layout map with elements of Title, Sub-Title, Scale, Arrow,  Legend and credits

Step 3: Map Display
Export map to Jpeg format

Conclusion:

The entity features for the chosen location are processed and displayed using ArcView 3.2a.

Arcview3.2a: Representing Polygon Entity

Aim:
To create polygon entity features for the chosen location

Procedure:

Step 1: Map Input
Identify the polygon Entities and the location datasets. For this session, Lakes were located as polygon entities and Provinces of the country of Canada as Location

Step 2: Map Processing
·         Symbolize the Polygon entities using “Symbol Selector”
·         Label the Polygon  entities with the “Name” of Lakes
·         Layout map with elements of Title, Sub-Title, Scale, Arrow,  Legend and credits

Step 3: Map Display
Export map to Jpeg format


Conclusion:

The polygon entity features for the chosen location are processed and displayed using ArcView 3.2a.

Arcview3.2a: Representing Line Entity

Aim:
To create Line entity features for the chosen location

Procedure:

Step 1: Map Input
Identify the Line Entities and the location datasets. For this session, Rivers were located as line entities and Provinces of the country of Canada as Location
Step 2: Map Processing
·         Symbolize the line entities using “Symbol Selector”
·         Label the line entities with the “Name” of Rivers
·         Layout map with elements of Title, Sub-Title, Scale, Arrow,  Legend and credits

Step 3: Map Display
Export map to Jpeg format

Conclusion:

The line entity features for the chosen location are processed and displayed using ArcView 3.2a.

ArcView3.2a: Representing Point Entity

Aim:
To create point entity features for the chosen location

Procedure:

Step 1: Map Input
Identify the Point Entities and the location datasets. For this session, Cities were located as point entities and Provinces of the country of Canada as Location

Step 2: Map Processing
·         Symbolize the point entities using “Symbol Selector”
·         Label the points entities with the “Name” of Cities
·         Layout map with elements of Title, Sub-Title, Scale, Arrow,  Legend and credits

Step 3: Map Display
Export map to Jpeg format

Conclusion:

The point entity features for the chosen location are processed and displayed using ArcView 3.2a.

GIS Exchange

Alas, here we are on a blog which is meant to disseminate everything about GIS. It is a platform where knowledge will be shared, ideas will be exchanged, doubts will be clarified and most of all passion of GIS domain will be curious explored. I believe that best tutor or teacher is one who makes fresh minds comprehend complex things by using simple terms or analogies. This belief will be reflected in each of the posts, in my blog. I will use a language style and procedural steps to document both simple and complex map outputs.

The Plan for now is structure the blog into four segments.

1. Conceptual (Tagged as concepts)
2. Tools & Analysis (Tagged by Software Product name)
3. Research, Analysis & impacts (Tagged as implementations)
3. Web Application (Tagged as Application and technology name)

Analysis and web application may lure readers to simply repeat whatever is prescribed. But, i strongly recommend not to do so. It is imperative that an GIS Analyst understand every bit of concepts behind every technique or tool, for it is in those tiny detailing lies the treasures of information that can be extrapolated from your complex or large data sets. I will try to share most of my conceptual understand under separate post treads, but if it is not found on my blog, please search for additional resources (books, journals or web), and then come back for procedures listed here. Technology has given us products, tools and techniques, that can be automated. Replicating them is just a matter of  gaining skill expertise over time. But what really differentiates an analyst from the ordinary, is the conceptual understanding of domain knowledge he posses.

To start with, the blog will have posts of my post grad record documents, which will be handy for student community. What will follow these records will be industry best practices, domain trends and analysis methodologies, all within the scope of geo-informatics and GIS.

So, milk the most from out of this blog! Email or post comments if you ave any questions! Comment your perspective or ideas,.